CASE STUDY // 02
CLV-NPS — The VIP Paradox
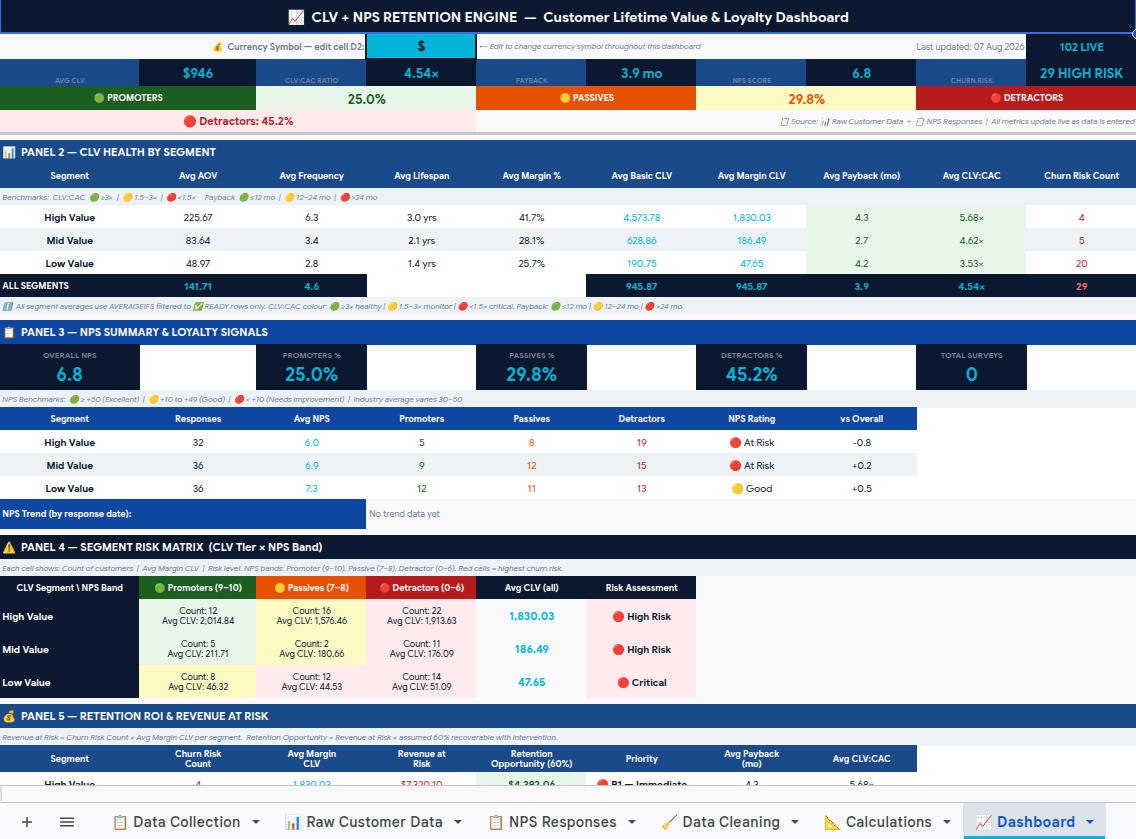
A synthetic 102-customer dataset run through the CLV-NPS engine surfaces a real limitation in acquisition-cost-based risk scoring: 21 customers holding over half of total lifetime value can never be flagged at-risk, because the flag's own math is undefined for anyone acquired for free.
$51,507
Margin-Adjusted CLV held by 21 zero-CAC customers — 53.4% of every dollar in the dataset
-43.8
NPS score for that exact segment (High Value) — the worst-scoring in the dataset
0
Times the Churn Risk flag can ever fire for a zero-CAC customer, by design
THE ACTUAL DASHBOARD
THE PROBLEM
A repeat-purchase business tracks Customer Lifetime Value to see who's worth protecting, and NPS to catch dissatisfaction early. Most tools score the two separately and never check whether they agree — if the revenue math looks fine, nobody looks any further, even when a live warning sign is sitting one sheet over.
THE RESOLUTION
The engine turns six inputs per customer (segment, average order value, purchase frequency, lifespan, gross margin %, acquisition cost) into Basic CLV, Margin-Adjusted CLV, Payback Period, and a CLV:CAC Ratio, then raises a Churn Risk flag whenever CLV:CAC drops below 1.5x or Payback runs past 24 months. A separate NPS sheet tracks sentiment by segment. Built in Google Sheets + Excel VBA — no CRM, no data team.
WHAT THE ENGINE DID
CLV Calculation
Computed Basic CLV and Margin-Adjusted CLV for 102 synthetic customers from average order value, purchase frequency, lifespan, and gross margin. Twenty-one of these customers were acquired at zero cost — referral, word-of-mouth, fully organic.
CLV:CAC & Payback
Both metrics are defined as a ratio against acquisition cost. For the 21 zero-CAC customers, the sheet's own guard logic left both cells blank rather than dividing by zero — a documented, correct behavior, not a data error.
Churn Risk Flag
Checked whether the built-in risk flag fired for the zero-CAC cohort. It never can: the flag's trigger condition requires a numeric CLV:CAC or Payback value, and a blank cell fails that check every time, regardless of the customer's actual standing.
NPS Cross-Check
Pulled the linked NPS sheet for the same customer base. The zero-CAC customers all sit in the 'High Value' segment — and High Value turned out to be the worst-scoring segment in the entire dataset for real sentiment.
THE RESULT
Across the 102-customer set, 21 customers — 20.6% of the base — hold $51,507 in Margin-Adjusted CLV, 53.4% of every dollar in the dataset. None of them can ever trip the Churn Risk flag, because CLV:CAC Ratio and Payback Period are both undefined when acquisition cost is zero, and a blank cell reads as 'not at risk' rather than 'unmeasured.' Meanwhile, 29 paid-acquisition customers with a genuinely thin CLV:CAC ratio do get flagged correctly — the tool isn't broken, it's specifically blind to anyone who cost nothing to acquire. The NPS sheet shows why that blindness matters here: the High Value segment, home to the entire zero-CAC cohort, posts an NPS of -43.8 (59.4% Detractors) against -16.7 for Mid Value and -2.8 for Low Value — real, measurable dissatisfaction sitting in exactly the segment the Churn Risk flag has no way to see, because Churn Risk never reads the NPS sheet at all. The practical fix costs nothing extra — put every zero-CAC customer on a manual NPS/engagement review schedule, since the tool's own risk math will never flag them either way. Illustrative synthetic data — not a real client result.